

Quick answer.
Net revenue retention can rise while gross profit falls, because NRR measures retained and expanded revenue, not the cost of delivering it. When a contract grows on a price never tied to current cost-to-serve, usage scales revenue and margin erosion together. CFOs need two views at renewal: revenue retention and the gross profit retained from the same cohort.
Executive summary
I have stopped asking finance teams whether they know their gross margin. Most do. I ask a harder question: can you prove the current margin on one material contract, before lunch, without commissioning a spreadsheet exercise?
That question exposes the real problem. Aggregate gross margin may be correct in the general ledger while contract economics remain difficult to reconstruct. The original quote captured the price but not always the cost assumptions behind it: vendor costs changed, cloud consumption moved, labor mix shifted, scope expanded, and the renewal inherited the old rate anyway.
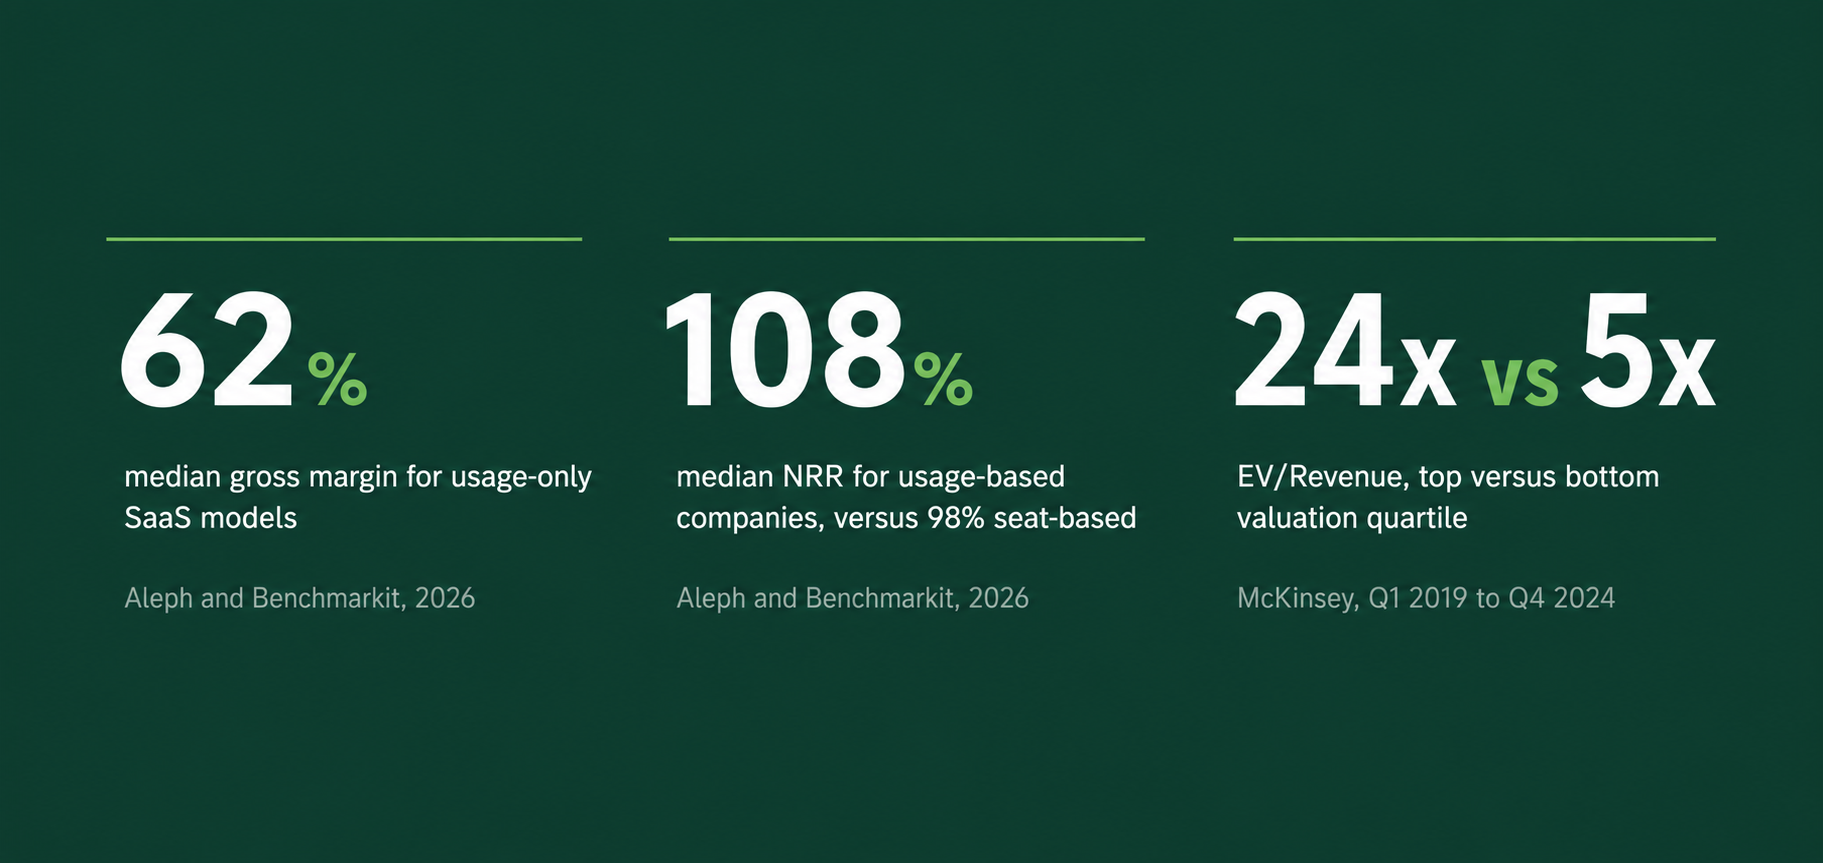
This matters more in 2026 because consumption pricing creates a powerful trade. In the 2026 Aleph and Benchmarkit benchmarks, built on full-year 2025 data from 342 SaaS and AI-native companies, usage-only businesses posted a 62 percent median gross margin against an 80 percent median across the wider sample. Yet the same research found usage-based companies producing 108 percent median NRR against 98 percent for seat-based models.
The commercial lesson is not that usage pricing is bad; it is that revenue expansion and gross profit expansion are different outcomes. The CFO question for every renewal is therefore simple:
This article answers it with one worked example, one additional management metric, and seven numbers finance can run on its five largest contracts this week.
The $40 endpoint that quietly became a 4.5 percent margin contract
Consider an illustrative managed services contract. These are not customer results; they are deliberately simple numbers any finance team can replace with its own.
A provider charges $40 per managed endpoint per month. At signing, the direct and attributable cost-to-serve is $34, a 15 percent commercial margin. The contract covers 5,000 endpoints over three years at a flat rate.
Assume cost-to-serve rises 6 percent annually: a modelling assumption, not an industry benchmark.
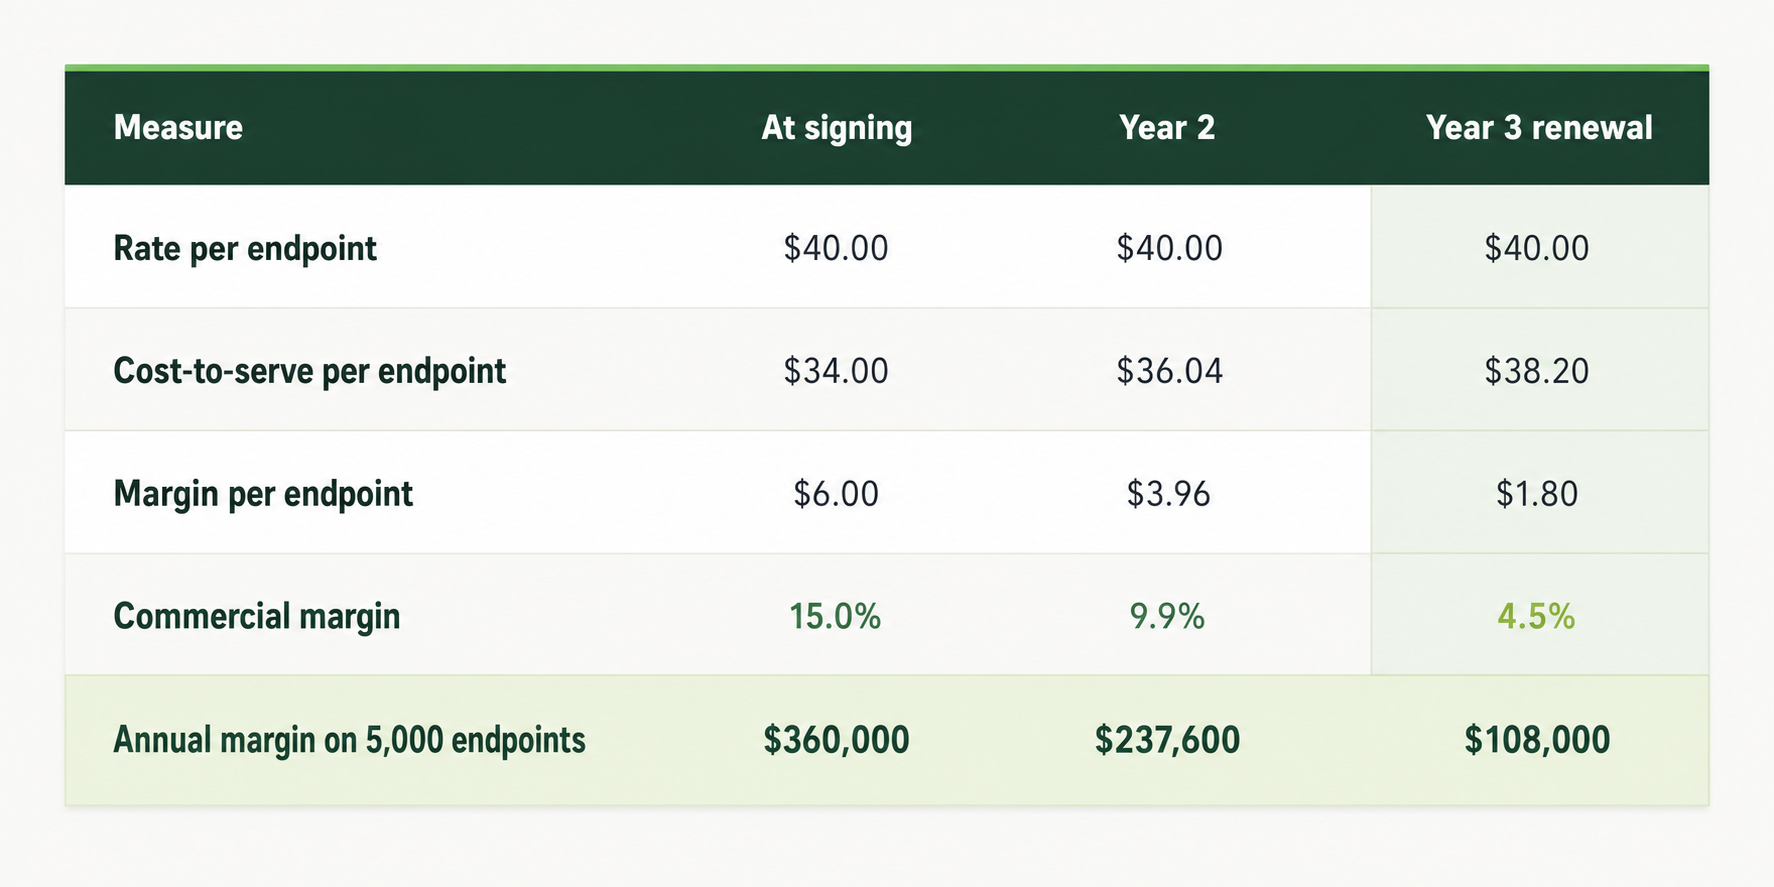
No discount war, no churn, no usage collapse. The account could look healthy in a revenue report while annual margin fell by roughly $252,000 from the signing case.
If volume then grows, the apparent success becomes more deceptive: each new endpoint adds $40 of revenue but only about $1.80 of margin at the Year 3 cost level. The business is scaling weak unit economics.
Why cost-to-serve belongs in the commercial decision
That erosion is why cost-to-serve belongs in the commercial decision, not only a quarterly variance report.
One accounting distinction matters. Cost-to-serve is a management view of the cost attributable to delivering a service to a customer, and it may include items classified outside cost of revenue under accounting policy. It should be reconciled to, but not casually presented as identical to, GAAP or IFRS gross margin. Finance should define which direct costs, shared delivery costs, support costs, third-party licenses, infrastructure costs, and labor allocations belong in the measure.
The precision makes the analysis more credible, not less.
NRR is a revenue metric, not a gross profit metric
Net revenue retention answers an important question: how much recurring revenue remains from the starting customer cohort after expansion, contraction, and churn?
It does not answer how much gross profit remains.
The formula:
NRR = (starting recurring revenue + expansion − contraction − churn) / starting recurring revenue
Two contracts with identical NRR:

Both report 110 percent NRR. Only one created more gross profit; the other grew revenue while losing 40 percent of its original gross profit. NRR cannot tell the difference because it was never designed to.
For internal management, pair NRR with a cohort gross-profit retention view:
Cohort gross-profit retention = ending gross profit from the starting customer cohort / starting gross profit from that cohort
This is not a standardized GAAP or IFRS metric, and companies should not present it as one. It is a management diagnostic: it shows whether expansion, contraction, repricing, and cost drift are improving or weakening the profit generated by the installed base.
The board-level epiphany:
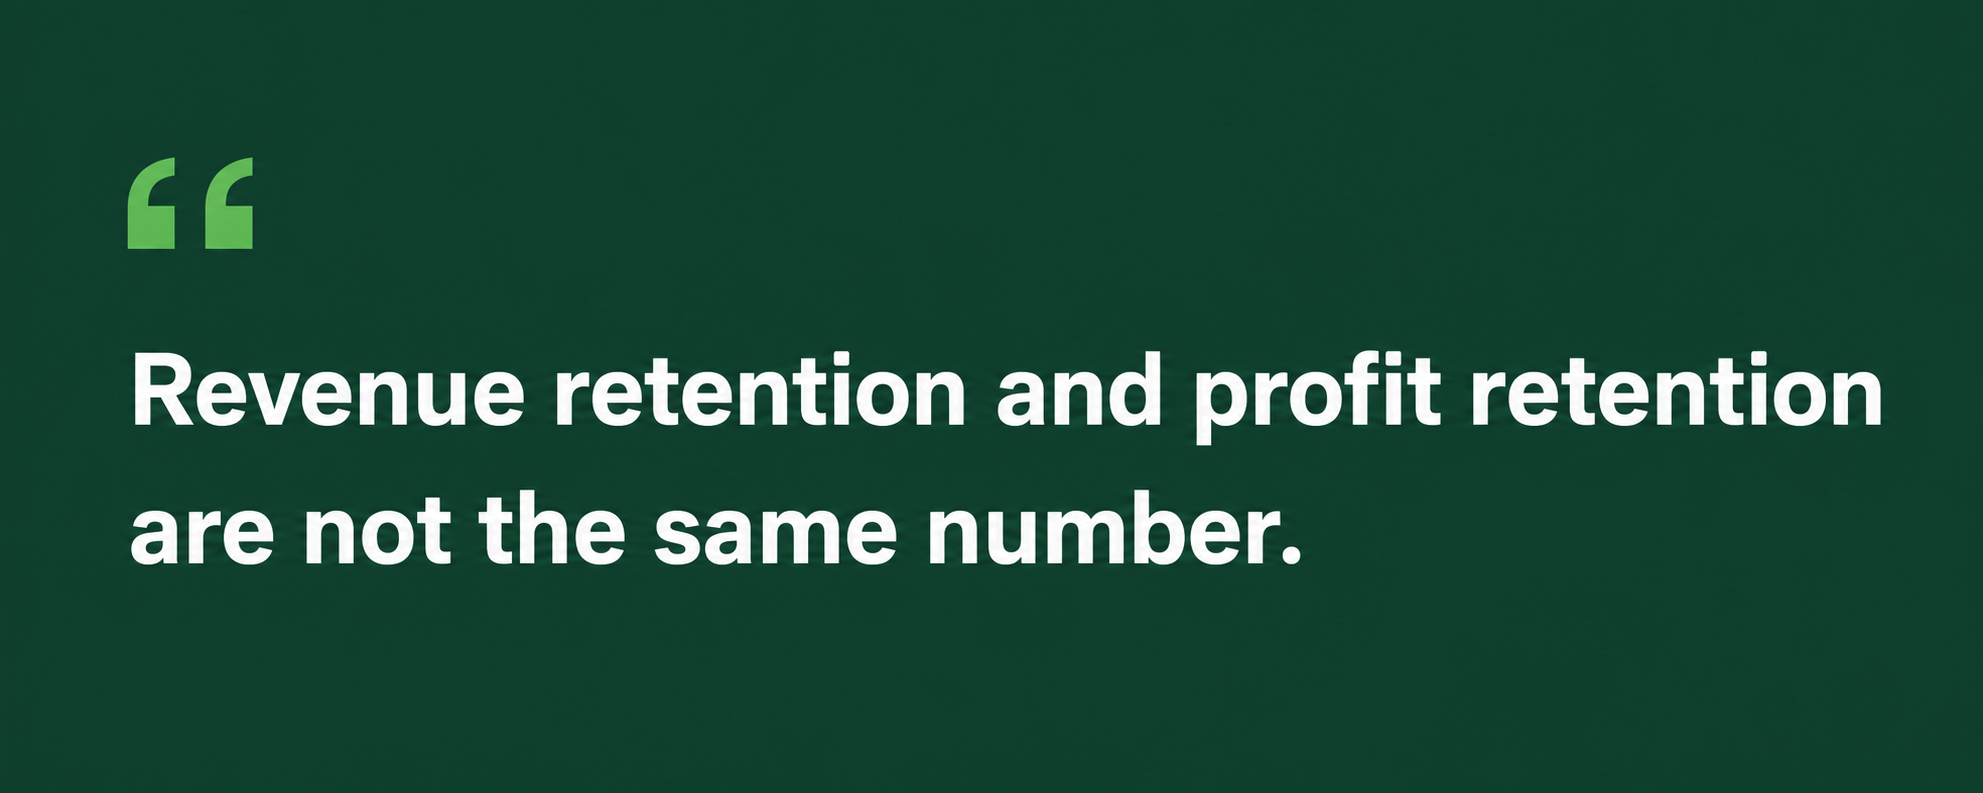
Once a board sees both, high NRR can no longer conceal unprofitable expansion.
What the 2026 benchmarks actually say
The strongest case needs a few figures used correctly, not a wall of statistics.
Usage pricing improves expansion, but can compress margin
The 2026 Aleph and Benchmarkit benchmarks report 108 percent median NRR for usage-based companies against 98 percent for seat-based, and 62 percent median gross margin for usage-only models against an 80 percent median across the broader sample.
These figures do not prove usage pricing causes weak margin everywhere; cohort mix, scale, infrastructure intensity, services content, and accounting policy all matter. They do establish the management problem: the model with the strongest automatic revenue expansion can carry the most variable delivery cost.
AI is making the risk more visible. Deloitte’s 2026 analysis of token economics and the AI P&L argues that usage, model complexity, and autonomous workflows can make AI costs nonlinear and hard to forecast. In plain English: a price tied to customer activity needs a cost model tied to the activity that actually consumes infrastructure, vendor capacity, and labor.
Retention quality affects valuation, but correlation is not causation
McKinsey’s analysis of more than 100 B2B SaaS companies found that companies in the top quartile of valuation multiples carried a median enterprise value to revenue multiple of 24x, against 5x for bottom-quartile peers, across Q1 2019 to Q4 2024. The top-valued group reported NRR of 113 percent against 98 percent for the bottom group.
The accurate conclusion is not that 15 points of NRR mechanically create a fivefold valuation increase; valuation reflects growth, profitability, durability, market position, and more. The conclusion is that strong retention travels with the efficient-growth characteristics investors reward.
Software Equity Group’s Q4 2024 public SaaS analysis makes the relationship more specific: NRR above 120 percent traded at a median 11.7x EV to trailing revenue, while below 100 percent traded at 4.1x.
That premium is valuable only if expansion remains economically sound. Revenue renewing at a deteriorating margin creates less cash to fund product, sales, and service, and diligence will still test the quality of the earnings underneath the recurrence.
The retention floor is getting weaker
The 2026 gross revenue retention benchmark reports median GRR falling from 88 percent to 84 percent in 2025, with the top quartile at 91 percent. Because GRR excludes expansion, it reveals how much revenue is being lost before upsell and usage growth cover the gap.
A company can show acceptable NRR while expansion masks a weakening base. Add gross profit erosion, and three problems hide inside one reassuring number:
- More contraction or churn in the installed base.
- Expansion carrying the retention result.
- Lower gross profit on the revenue that remains.
That is why NRR should never be reviewed alone.
Why finance struggles to prove contract economics
The problem persists in well-run companies because the commercial record is fragmented. The rate may live in CPQ or a spreadsheet, vendor cost in procurement, labour cost in the PSA, cloud consumption in a separate billing feed, amendments in CLM, and actual revenue and cost appear later in the ERP, and without ERP integration the commercial context is lost. Each system can be accurate and the combined answer can still be late.
The missing link is four related facts:
- What the business believed the service would cost when it approved the deal.
- Which price, discount, scope, and margin rule it approved at signing.
- What delivery actually cost over the contract term.
- Which version of those facts should govern the renewal.
If those facts cannot be reconstructed, finance has aggregate truth without contract-level decision truth: the ledger reports total gross margin correctly while the renewal team lacks a reliable forward view of the next contract period.
This is the commercial Missing Mile: the gap between quoted economics and delivered economics.
The renewal is where margin gets corrected or compounded
Most companies treat renewal as a retention event, a service contract milestone rather than a repricing opportunity. In a managed service, consumption, telecom, cloud, or XaaS model, it is also the contract’s most important repricing event. Five common practices compound margin erosion.

1. Anchoring to the old rate
The renewal starts from the prior price plus an assumed uplift; current cost-to-serve never enters the model. A 3 percent increase can feel like a win even when delivery cost rose 7 percent.
2. Treating all cost drift as inflation
Inflation is only one driver. Vendor mix, cloud architecture, support intensity, service credits, custom work, usage shape, and labor seniority all move the cost base; a blanket uplift misses the contract-specific cause.
3. Absorbing scope without repricing
More sites, integrations, reporting, support, or onboarding becomes part of the relationship. Revenue stays flat while the service obligation quietly expands, adding incremental cost that no one reprices.
4. Negotiating with relationship evidence only
Procurement arrives with a benchmark and the account team with customer history. Finance needs a third form of evidence: the current economics of the service and the trade-offs available to preserve value.
5. Expanding the least profitable line
Usage growth feels positive, so the business encourages it. Without line-level margin visibility, the fastest-growing component can contribute the least profit.
None of this argues for indiscriminate price increases. Some contracts should accept a lower margin for strategic entry, platform adoption, or profitable adjacent expansion; the difference is whether that trade is explicit, approved, time-bound, and visible. Unseen margin erosion is leakage. A conscious investment is strategy.
What a verifiable cost-to-serve architecture looks like
The answer is not a larger spreadsheet; it is a governed feedback loop from cost to quote to actuals to renewal.
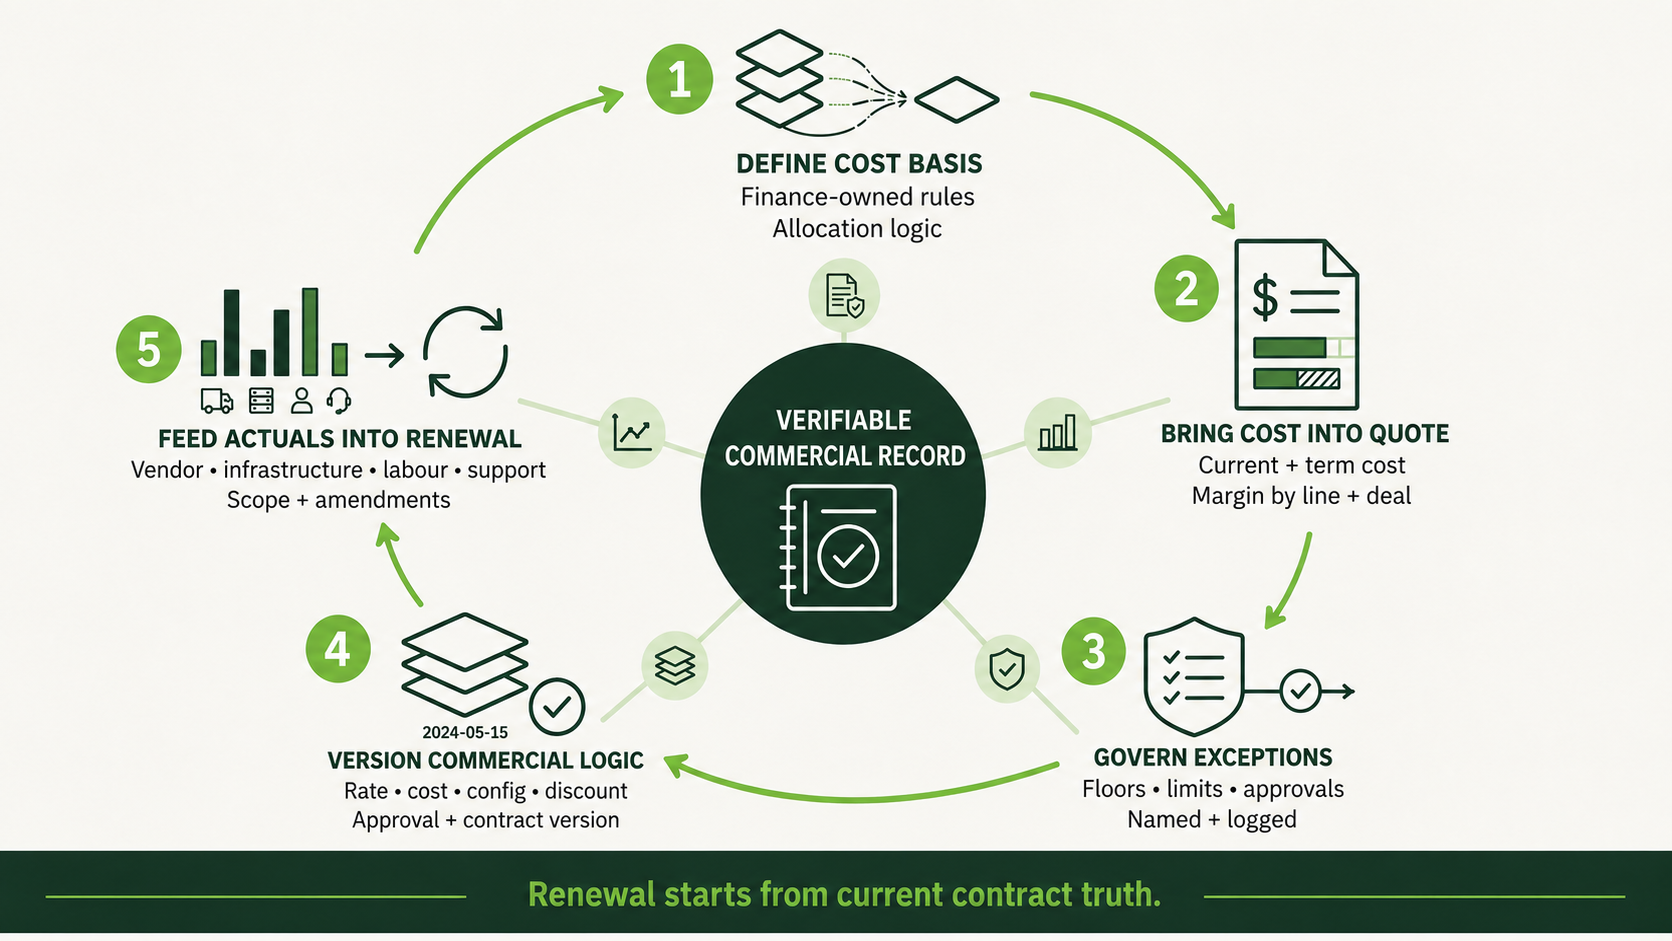
1. Define the cost basis
Finance decides what belongs in cost-to-serve and how shared costs are allocated, distinguishing accounting gross margin from broader contract contribution economics where required.
2. Bring cost into the quote
The commercial team sees current cost inputs, expected cost over the term, and margin by line and deal before the price is committed.
3. Govern exceptions
Margin floors, discount limits, hurdle rates, escalation clauses, and approval thresholds operate as system rules. Exceptions are permitted but named, approved, and logged.
4. Version the commercial logic
The business can reconstruct the rate card, cost assumption, configuration, discount, approval, and contract version used at signing or amendment.
5. Feed actual delivery economics back into renewal
Actual vendor, infrastructure, labor, support, and service data refresh the forward cost view, so the renewal starts from current contract truth, amendments and scope changes included, not from a copied quote.
This architecture does not replace the ERP or the general ledger; it improves the quality of the commercial decision that reaches them. That distinction matters. CPQ is not the accounting system of record. For complex deals, it should be the governed system of commercial intent.
Seven numbers to run on your top five contracts this week
Do not begin with a transformation program; begin with five contracts, their total contract value, and one working session.
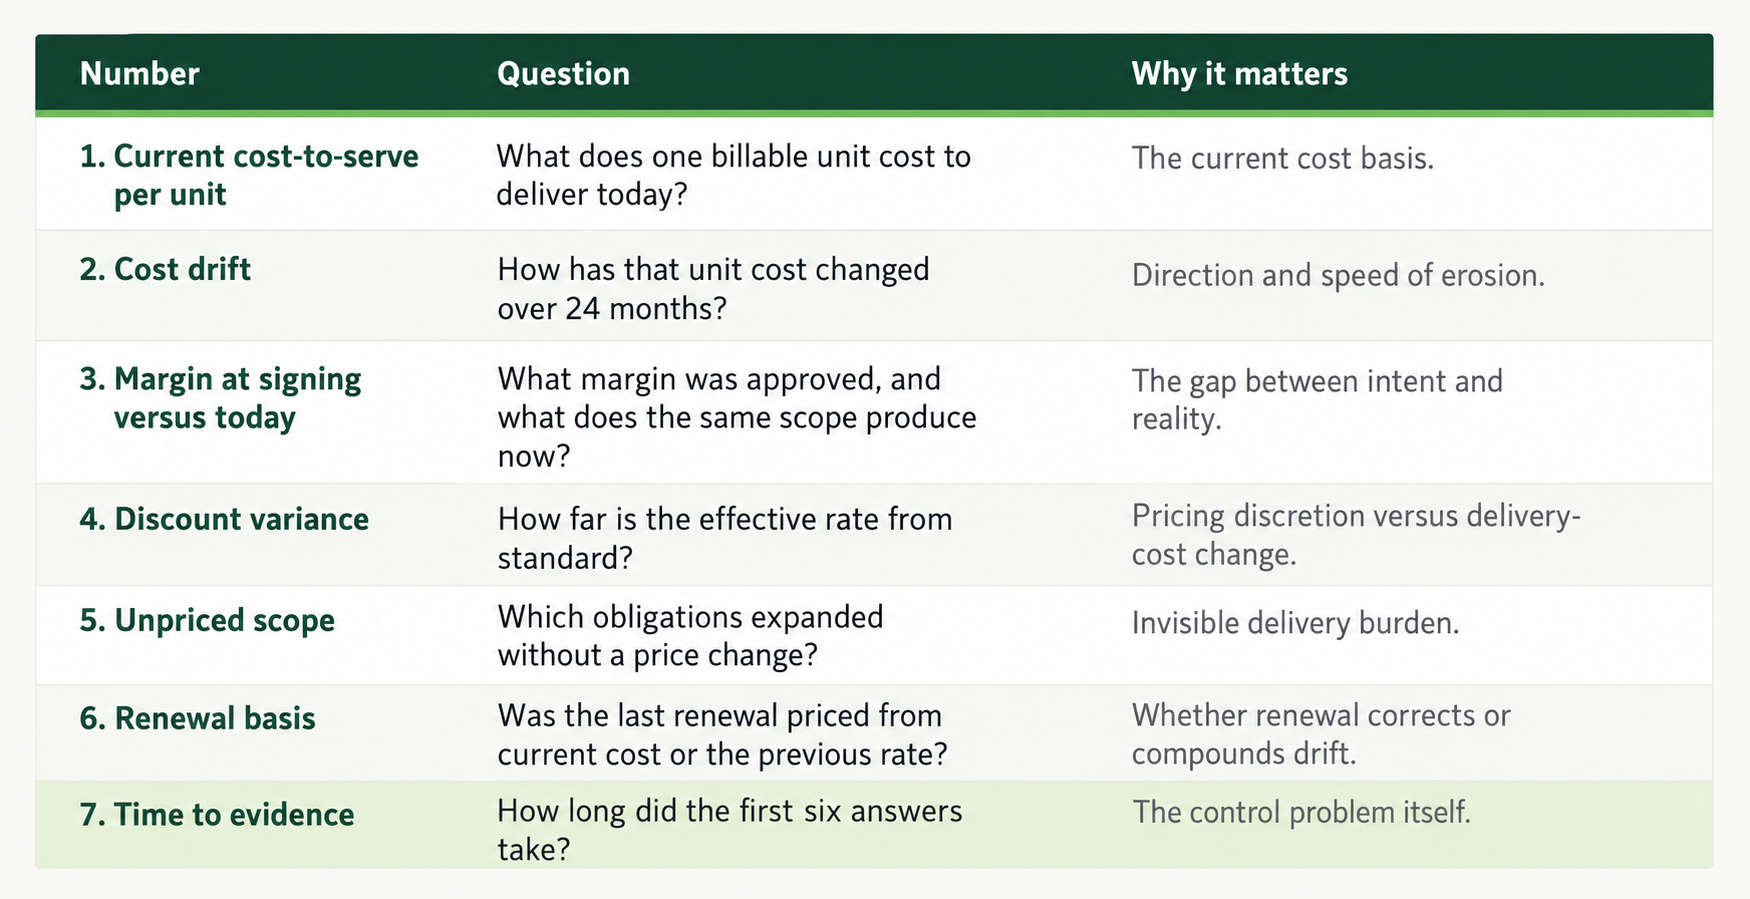
The seventh number is often the most revealing. If a finance, sales operations, and delivery team needs several weeks to reconstruct five contracts, that is not a reporting inconvenience; it is a commercial control gap. The first target is not perfect data. It is repeatability: the same definitions should produce the same answer next month, at renewal, and during diligence.
What CFOs should require from CPQ
A CFO evaluating CPQ for a complex services or consumption business, whether replacing Salesforce CPQ or building from scratch, should ask six things:
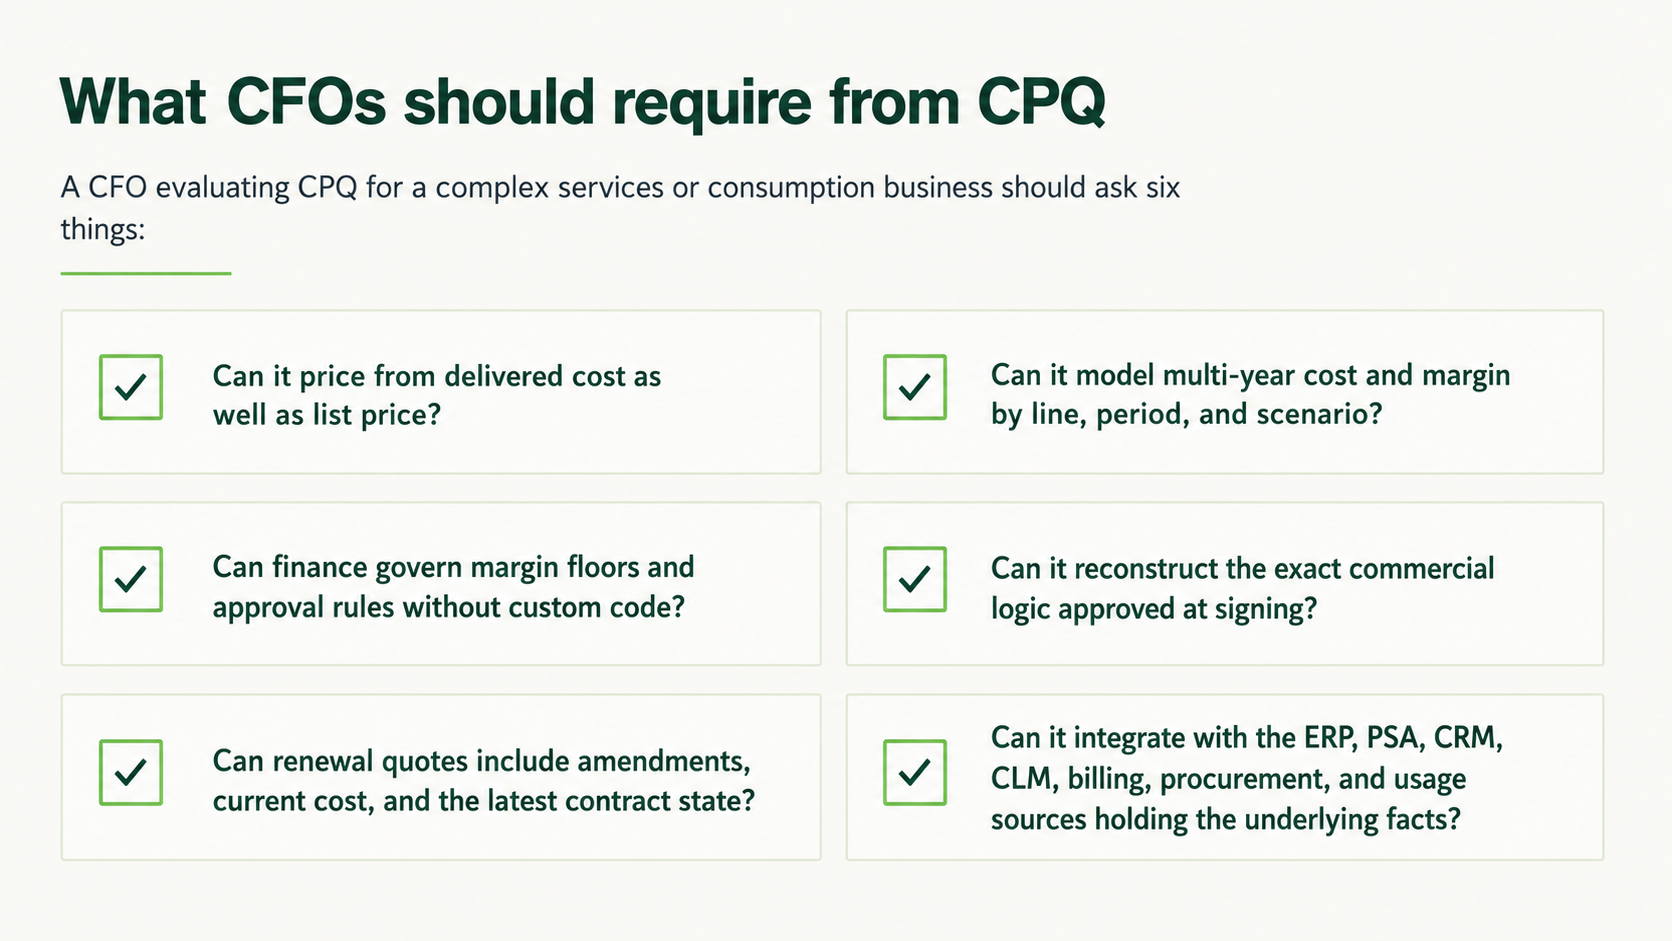
A platform that cannot answer those questions may automate document production without improving commercial control.
Nucleus Research’s 2025 analysis of the cost of CPQ inaction reported customers of modern CPQ platforms cutting quoting errors 20 to 30 percent, approval cycles 15 to 20 percent, revenue leakage 2 to 4 percent, and improving margins 2 to 5 percent.
Those are market-level reported outcomes, not a promise that every implementation will produce the same result. They do show why CPQ has become a financial performance decision, not merely a sales productivity purchase.
Why servicePath™
servicePath™ CPQ+ is built for enterprises selling complex technology products and services across multi-year agreements, changing cost inputs, amendments, renewals, and multiple systems.
The platform gives teams a financial view of revenue and margin at quote level, supports governed pricing and approval logic, and preserves the commercial context required to evaluate complex deals.
The customer evidence is practical:
- Dell EMC cut complex proposal changes from a full day to as little as 15 minutes, with partners building proposals around cost-for-capacity metrics.
- telent replaced a failed legacy CPQ implementation in eight weeks, moving complex quotes out of spreadsheets and giving leadership clearer margin visibility.
servicePath™ has been positioned as a Visionary in the Gartner Magic Quadrant for Configure, Price and Quote Applications for four consecutive years.
Recognition matters. The operating test matters more: can finance trace the cost assumption, pricing rule, approval, contract change, and renewal decision on a material deal without rebuilding the story after the fact?
That is the standard servicePath™ is designed to meet.
Frequently asked questions
What is cost-to-serve?
Cost-to-serve is a management view of the direct and attributable cost of delivering a product or service to a specific customer or contract: infrastructure, third-party licences, delivery labour, support, vendor charges, and allocated shared costs. Reconcile it to accounting policy; cost-to-serve and reported cost of revenue may not be identical.
How does consumption pricing affect gross margin?
Consumption pricing links revenue to usage, but delivery cost may rise with usage too. The 2026 Aleph and Benchmarkit data reports 62 percent median gross margin for usage-only SaaS models against an 80 percent median across the wider sample. Any one company’s result depends on cost structure, scale, price architecture, and customer mix.
Can NRR increase while gross profit declines?
Yes. NRR measures recurring revenue retained from a starting cohort, including expansion; it does not deduct the cost of serving that cohort. If usage or upsell grows revenue while unit cost rises faster than price, NRR improves while gross profit falls.
What is cohort gross-profit retention?
It compares ending gross profit from the starting customer cohort with that cohort’s gross profit at the start of the period. It is an internal management diagnostic, not a standardized GAAP or IFRS measure. Paired with NRR and GRR, it separates profitable expansion from growth with weaker economics.
How should finance calculate margin at renewal?
Start with the current rate and current cost-to-serve for the renewed scope. Include amendments, unpriced scope, volume changes, vendor costs, infrastructure consumption, labour mix, service obligations, and planned escalators. Compare against the margin approved at signing and the current margin floor.
What should a CFO ask before approving a CPQ investment?
Whether the platform can model cost and margin over a multi-year term, govern margin and discount exceptions, preserve every approved version, generate renewals from current contract truth, and integrate with the systems holding actual cost and usage. If not, it may accelerate quoting without solving margin control.
Numbers before demos
Take the five contracts your board would ask about first. Run the seven-number baseline. Measure the economics and the time required to prove them.
If the answers are already available, you have a strong commercial control foundation. If they require a cross-functional reconstruction, that is not a failure. It is a quantified requirement.
- Talk to a CPQ Architect about your rate card, cost model, and renewal process. Not a sales call: a technical conversation about where your quoted economics and delivered economics separate, and what closing the gap would require.
- Book a margin-verification working session. We run your top five contracts through the seven-number baseline together. You leave with the gaps mapped, whether or not we ever speak again.
- Subscribe to Executive Conversations, Daniel Kube’s newsletter and podcast for revenue and finance leaders in tech. The rest of this series, including the AI pricing audit-controls companion, publishes there first.
Your numbers first. The software conversation second.
Related reading and listening
On the servicePath™ blog: The Missing Mile: AI Risk and Revenue Leakage defines the gap between quoted and delivered economics that this article’s renewal analysis depends on. Stop Fixing Deals. Start Engineering Margins. is the companion piece, with the five-risk framework and a five-question diagnostic for CFOs, CROs, and Heads of Commercial Excellence.
Revenue Architecture 2.0: Human-Led CPQ for 2026 sets out the control-plane architecture behind the “governed system of commercial intent” positioning. And Everything After the Quote Is Either Evidence or Assumption applies the evidence standard to every commercial artifact between the quote and the general ledger.
Listen: on the Executive Conversations podcast, Daniel Kube sits down with Dennis Ensing on scaling enterprises and navigating global markets, and with Brian Hartlen on 50 years of B2B marketing from mainframes to AI-native go-to-market.
Daniel also joined the CPQ Podcast to discuss servicePath™’s financial analysis tools and the role of cost-to-serve in enterprise quoting, and the CanadianSME Small Business Podcast for “AI in Sales: Gamechanger for Revenue Growth.”
About servicePath™
servicePath™ is a CPQ and Revenue Lifecycle Management platform for technology service providers with complex commercial models: catalogs, rate cards, delivered costs, pricing rules, approvals, quotes, and renewals in one governed, API-accessible system.
Customers include Dell , telent, Atos, Unisys, Park Place Technologies, TierPoint, Node4, Ensono, and Telefónica. Headquartered in the Toronto area, with offices in London and Dubai. Good Revenue Faster™.
The $40 endpoint model is illustrative and is not customer data. Cohort gross-profit retention is presented as an internal management diagnostic, not a standardized GAAP or IFRS metric. Third-party benchmarks belong to their publishers and should be interpreted using the methodology and reporting periods in the linked sources. Customer outcomes are linked to the relevant servicePath™ case studies.