Executive Summary
Commercial excellence is not a project with an end date. It is a continuum — a compounding cycle of pricing governance, sales execution, RevOps maturity, and technology enablement that separates market leaders from everyone else. McKinsey found that fewer than 30% of firms achieve simultaneous revenue growth and margin expansion in any given year. Those that do deliver 9x total shareholder return — 18% versus 2%.
This article presents a four-stage commercial excellence framework, a five-step implementation roadmap, and the research-backed business case for building a governed commercial engine. Key findings: the average B2B company loses 3–5% of annual revenue to pricing leakage (MGI Research); CPQ delivers 121% average ROI with a 16-month payback (Nucleus Research); and Gartner predicts 40% of enterprise applications will embed AI agents by end-2026 — making governed commercial data the prerequisite for AI readiness, not an afterthought.
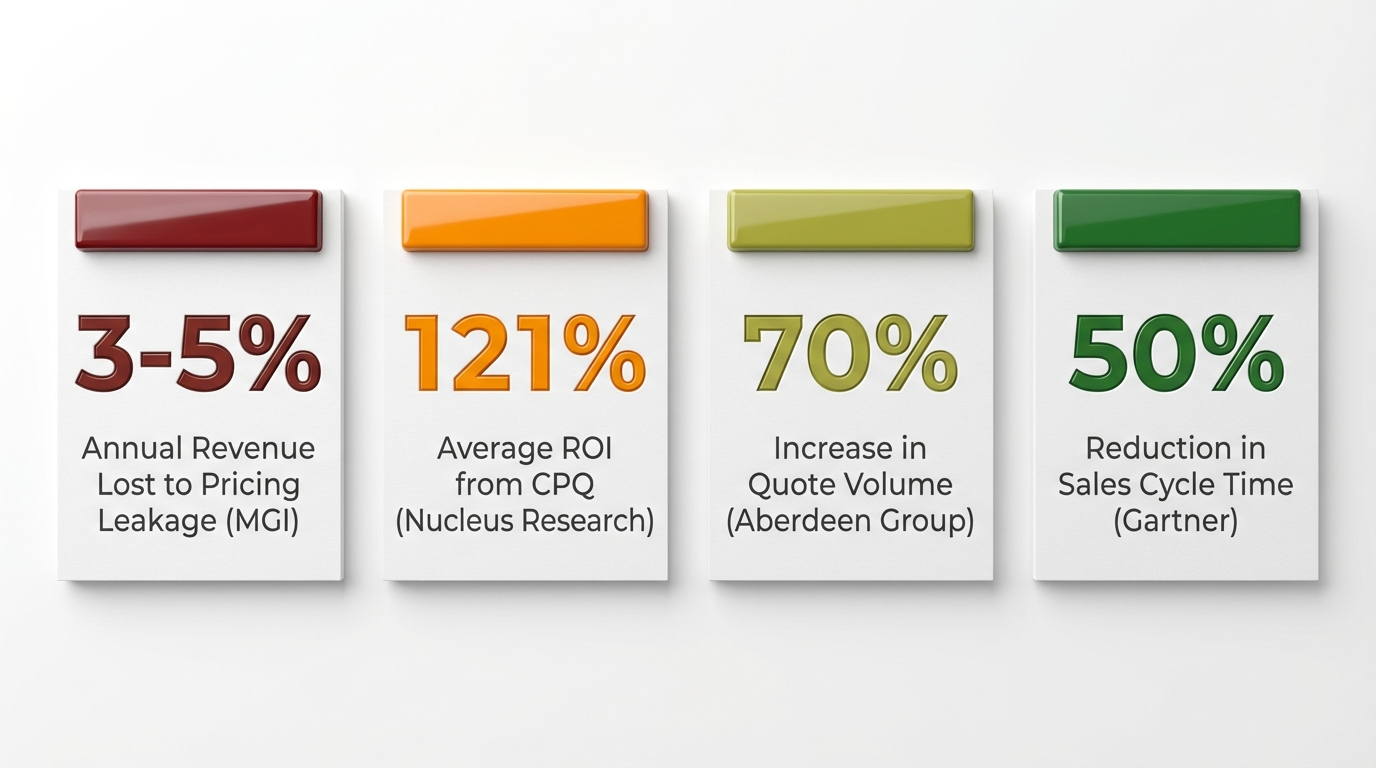
Table of Contents
- The Honest Truth Most Vendors Won’t Tell You
- Why 2026 Is the Inflection Point
- What Commercial Excellence Actually Means
- The Four-Stage Commercial Excellence Continuum
- Governance: The Backbone Nobody Wants to Build
- Technology Stack: Sip, Don’t Chug
- The Role-Based View: Who Benefits and How
- The 5-Minute Commercial Excellence Diagnostic (CFO Case)
- Implementation Roadmap
The Honest Truth Most Vendors Won’t Tell You
Most of the companies I talk to — mid-market, enterprise, scaling fast, recently acquired — have the same problem. They’re running revenue operations on vibes and spreadsheets. Their reps discount the moment a buyer pushes back. Finance is reconciling quotes in Excel three weeks after close. Nobody has real-time visibility into what margin actually looks like across the portfolio.
They call it “a process problem.” They fix it with a project. Six months later they’re exactly where they started. The moment you treat commercial excellence like a destination, you’ve already lost.
Here’s the number that should frame everything that follows. McKinsey’s analysis of the 1,200 largest public companies globally found that a 1% improvement in price realisation nets an average 8.7% improvement in operating profit. For a company with an 8% profit margin, 1% of unmanaged discounting erodes operating profit by the same magnitude. That compounds every quarter you leave it unaddressed.
Key takeaway: A 1% pricing improvement delivers 8.7% operating profit uplift. Unmanaged discounting erodes profit at the same rate — silently, every quarter.
👉 No pitch deck. No sales script. Just an honest look at where your commercial engine stands today. Book a Commercial Excellence Assessment. Your business. Your numbers. Your roadmap. Book your assessment →
Why 2026 Is the Inflection Point for Commercial Excellence
Gartner predicts 40% of enterprise applications will integrate task-specific AI agents by end-2026, up from less than 5% in 2025. That’s not a technology story. That’s a competitive moat story. The firms with clean commercial data, pricing rules embedded in systems, and automated approval workflows will make AI look like a superpower. The firms without? AI will amplify the chaos they already have.
The Deloitte Q4 2025 CFO Signals Survey found 87% of CFOs expect AI to be extremely or very important to finance operations in 2026. Yet only 14% have fully integrated AI agents into the finance function. The boardroom conversation has shifted from “should we do AI” to “why isn’t our AI delivering value yet.” The answer, almost universally: they’re trying to automate processes that were never governed in the first place.
You can’t automate a process that doesn’t exist. You can’t train AI on dirty pricing data. You can’t feed a deal-scoring model inconsistent discount histories pulled from 14 different spreadsheets. The window to build a governed commercial engine before AI becomes table stakes is closing fast.
Key takeaway: AI amplifies what you already have. If you have governed data, AI is a superpower. If you have chaos, AI scales the chaos.
What Commercial Excellence Actually Means
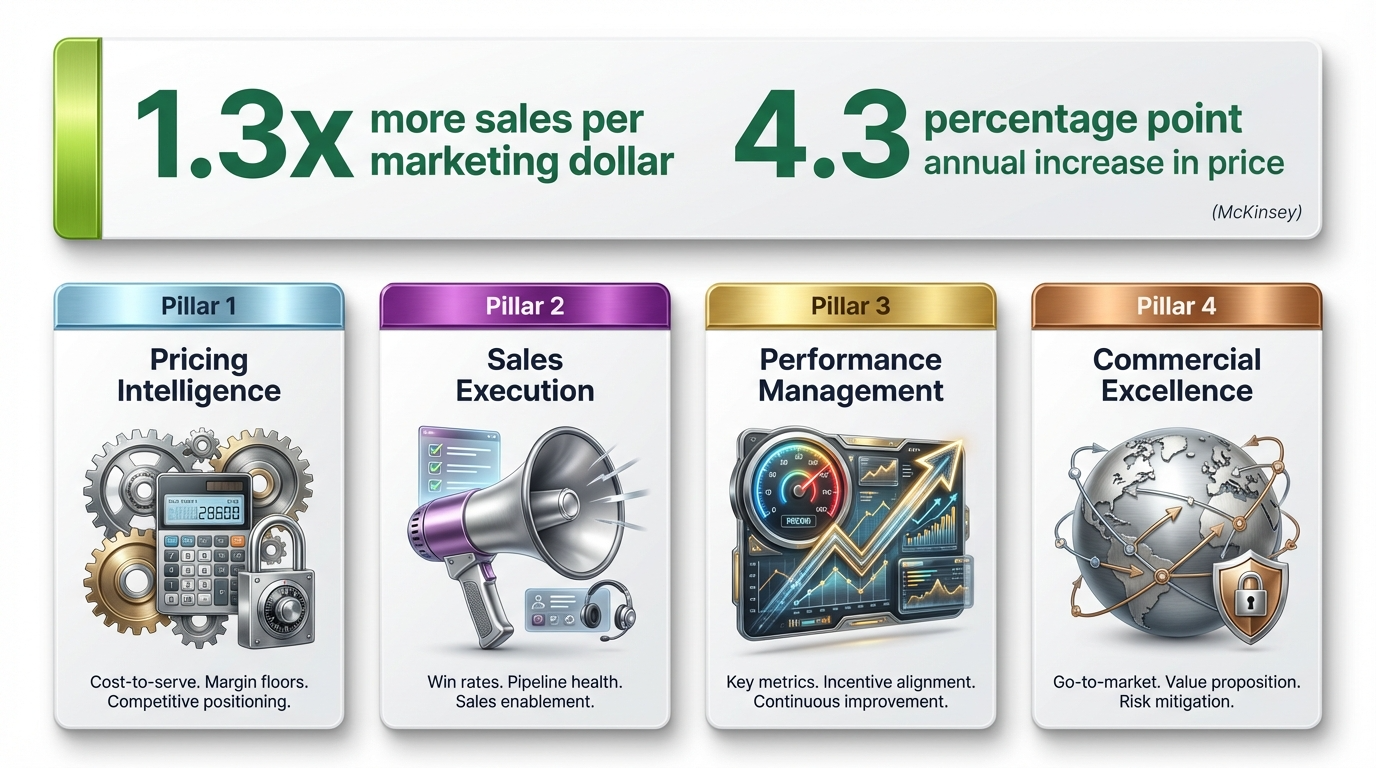
McKinsey found top-quartile companies achieve 1.3x more sales per marketing dollar and a 4.3 percentage point annual increase in price per equivalent unit versus peers. That’s a structural advantage that compounds every year. There are four pillars of commercial excellence.
Pricing Intelligence. An active, governed system that knows your cost-to-serve, margin floors, and competitive positioning — and enforces them.
Sales Execution. Bain’s 2025 B2B Growth Divide found 82% of companies have sales plays but only 21% consistently execute them. That gap is your leakage problem. Sales execution also includes territory design, account segmentation, comp alignment, and pipeline quality — all enabled by the same governed data foundation.
Revenue Operations. Gartner forecasts 75% of high-growth B2B firms will have formal RevOps by 2026, up from under 30% recently. Companies making this transition report 36% higher revenue growth and up to 28% more profitability.
Technology Enablement. The right systems, integrated in the right sequence, at the right pace — because this is where most companies go catastrophically wrong.
Get all four pillars right and you’re building a commercial excellence engine that compounds: more margin, better data, better AI, better decisions.
The Four-Stage Commercial Excellence Continuum
I put this framework on the whiteboard with every new leadership team. Point to where you are. Be honest.
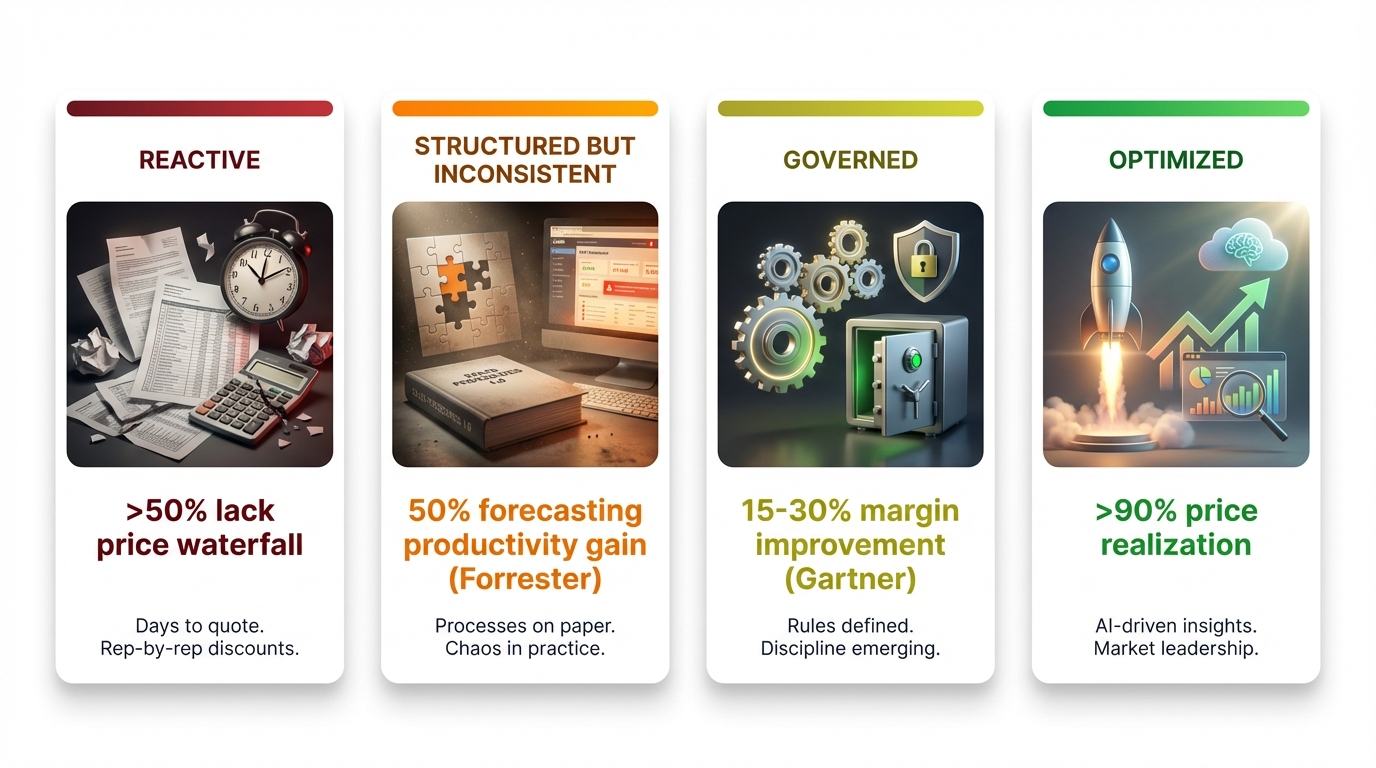
Stage 1: Reactive
Every deal is a bespoke negotiation. Discounting is a rep-by-rep decision. Quote time is measured in days. Finance finds out what margin looks like when the invoice goes out. More than 50% of mid-market organizations still lack a clear price waterfall, and more than 75% rely on reactive, spreadsheet-based cost-plus pricing rather than optimizing for actual realized pocket price (Pricing Excellence Roadmap 2026). You are not alone here — but you are leaving serious money on the table every quarter.
Stage 2: Structured but Inconsistent
You have processes. A price list. A CRM. But the processes live in a document nobody reads, the price list gets updated twice a year and immediately ignored, and the CRM data is whatever the rep typed in last week. Structured on paper. Chaotic in practice. Forrester notes that eliminating manual spreadsheet reconciliation at this stage can improve sales forecasting productivity by up to 50%. The gap between what you think you know and what the data actually shows is the gap your competitors are exploiting.
Stage 3: Governed
Pricing rules live in your CPQ. Discount approvals are automated. Real-time margin visibility exists. Nucleus Research found CPQ delivers 121% average ROI with a 16-month payback — plus 36% revenue increase, 42% admin cost reduction, and 56% quoting efficiency improvement. Bain found data-driven organisations win deals at a 12% higher rate. Dynamic pricing engines boost margins by 425–430 basis points.
Stage 4: Optimized and Compounding
AI-augmented pricing. Dynamic deal scoring. Continuous feedback loops. Every deal makes the next deal smarter. This is where commercial excellence transitions into Revenue Lifecycle Management — unifying CPQ, CLM, billing, and renewals under a single data architecture.
Most companies are stuck at Stage 1 or 2. The path to Stage 3 is not complicated. It’s just disciplined.
Key takeaway: The four stages: Reactive → Structured but Inconsistent → Governed → Optimized and Compounding. Most companies are stuck at Stage 1 or 2.
What Each Transition Requires
Each transition between stages is a fundamentally different kind of challenge. Treating them the same is one of the most common mistakes I see.
Stage 1 → 2 is a people and process effort: executive alignment, process documentation, and basic pricing hygiene. You’re defining margin floors, writing down discount policies, and cleaning your CRM data enough to trust it. Timeline: 6–12 months.
Stage 2 → 3 is a systems integration and data governance effort: CPQ implementation, CRM integration, automated approvals. But first — data remediation. If your account hierarchy is wrong and your product catalogue is inconsistent, CPQ won’t fix that; it’ll surface how broken it is. Budget 2–4 months for cleanup before you touch CPQ. Total timeline: 9–18 months.
Stage 3 → 4 is a data science and organizational maturity effort: clean historical data, analytics capability, and the organizational willingness to let data challenge assumptions. This is where pricing intelligence layers in. Timeline: 12–24 months building on the governed foundation.
💬 If this framing is useful, there’s more where it came from.
Follow Daniel Kube on LinkedIn for weekly no-BS insights on pricing governance, commercial excellence, and RevOps — straight from the operator’s desk. 👉 Follow Daniel →
Follow servicePath™ on LinkedIn for product updates, customer stories, and the latest on CPQ and Revenue Lifecycle Management. 👉 Follow servicePath™ →
Pricing Governance: The Backbone Nobody Wants to Build
Every month I meet an executive team that wants the output of a governed commercial engine without building governance. It doesn’t work that way. McKinsey is direct: transformations stumble without a framework aligning commercial leadership across functions. Technology alone is insufficient.
It starts with a Commercial Excellence Centre of Excellence — chaired by a VP of RevOps or CCO, with Sales, Finance, and Product represented. Three jobs: define rules (margin floors, discount thresholds, escalation triggers), embed them in systems (CPQ, CRM, CLM), and measure what matters weekly (margin quality, discount variance, quote accuracy).
McKinsey’s pocket price waterfall shows a 1% price increase generates an 8% operating profit improvement. Without governance, unstructured discounting silently erodes 200–400 basis points of gross margin annually.
ASC 606 and IFRS 15 add a layer CFOs understand immediately. Complex deals require revenue recognition rigour that spreadsheets cannot provide. Automated CPQ with embedded pricing rules gives finance the audit trail compliance demands. CoE cadence doesn’t need to be complicated: quarterly strategic review, monthly metrics, standing QBR agenda item.
Key takeaway: Without pricing governance, unstructured discounting silently erodes 200–400 basis points of gross margin every year.
What a Failed Commercial Excellence Programme Looks Like
I see this pattern quarterly. A company buys CPQ before defining pricing rules. On go-live, the system blocks discounts reps have offered for years. They revolt. Exceptions multiply until CPQ becomes a more expensive spreadsheet nobody follows. Twelve months later, adoption is below 40% and the technology gets blamed.
The technology wasn’t the problem. The company skipped governance — they automated before they standardized. Define the rules first. Get executive alignment on margin floors and discount authority. Then embed them in the system. In that order.
Technology Stack: Sip, Don’t Chug
Companies that buy CRM, CPQ, ERP, CLM, and AI in the same budget cycle spend 18 months in implementation hell. The philosophy at servicePath™ is simple: sip, don’t chug. Gartner research shows sales operations teams now spend 73% of their time on non-sales functions — up from 39% in 2019. Every stack layer added correctly reduces that number. Every layer added prematurely adds to it.
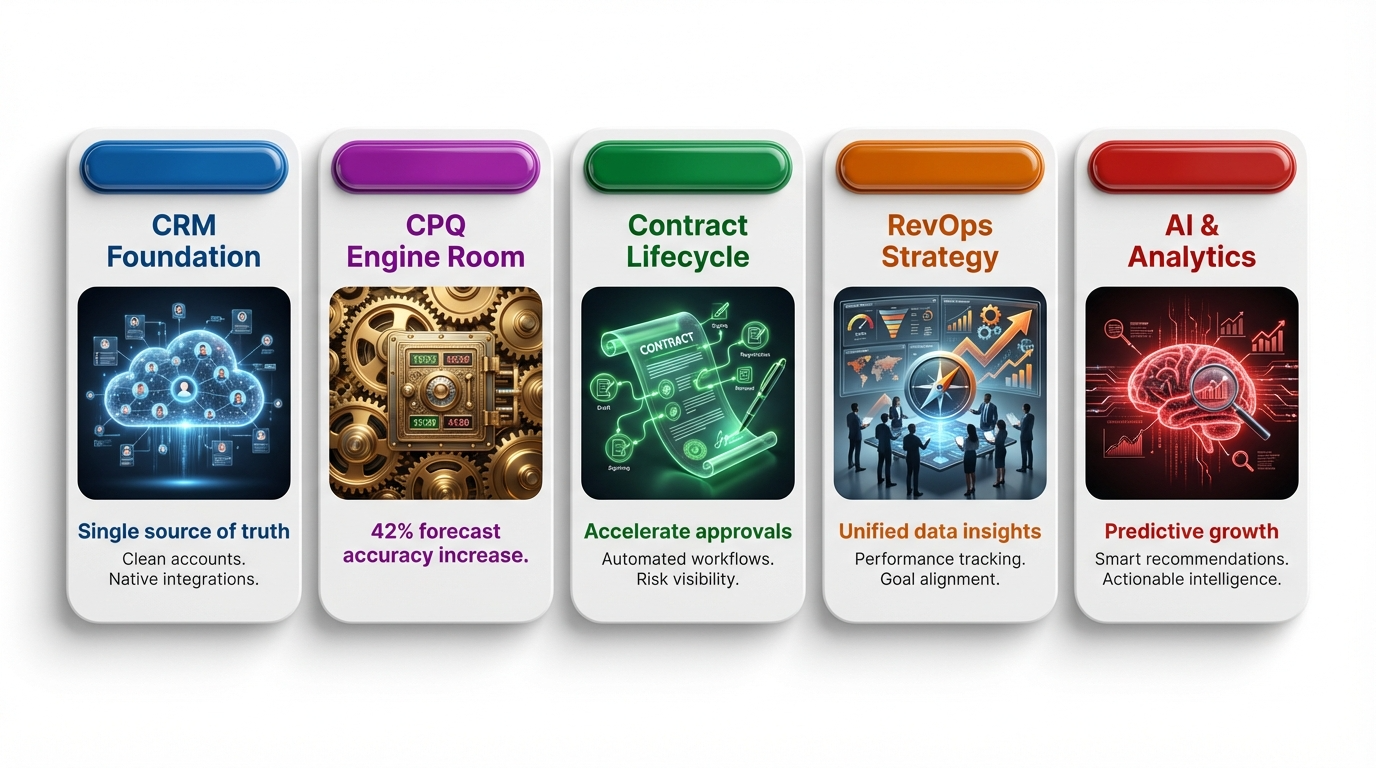
Step 1: CRM Foundation. Your CRM must be the single source of truth. Clean accounts. Consistent deal stages. servicePath™ integrates natively with Salesforce, HubSpot, Microsoft Dynamics 365, and NetSuite.
Step 2: CPQ — the Engine Room. Pricing rules live here. Discount approvals run automatically. Margin floors get enforced before a quote reaches a customer. Centralised CPQ across multiple CRM instances delivers up to 42% forecast accuracy improvement (servicePath™ CPQ Trends 2026).
Step 3: Pricing Intelligence. Cost-to-serve modelling, competitive benchmarks, margin optimisation by segment. This moves you from Stage 3 to Stage 4.
Step 4: Contract Lifecycle Management. CLM connects commercial terms to contracts — automating renewals and preventing entitlement creep three years into a five-year deal.
Step 5: Revenue Lifecycle Management and AI. With clean data flowing through the stack, AI has something real to work with: deal-scoring on actual margin data, pricing recommendations from real cost-to-serve, churn signals from commercial behaviour.
Key takeaway: Build your commercial technology stack in sequence. Every layer builds on the one beneath it. Sip — don’t chug.
How Commercial Excellence Differs by Business Model
The commercial excellence continuum applies universally, but the pricing governance challenges differ significantly by business model. Recognising this matters for implementation.
Pure SaaS companies face catalogue normalisation and tier consistency challenges. Governance focuses on discount authority by deal size and segment.
Managed services companies face custom scoping, blended labour rates, and SLA-based pricing. Governance must account for margin floors by service type and scope-change controls.
Hybrid models are the most complex. Bundled hardware-software-services pricing requires CPQ configuration for cross-portfolio dependencies — where a spreadsheet-native UI becomes critical.
The Role-Based View: Who Benefits from Commercial Excellence
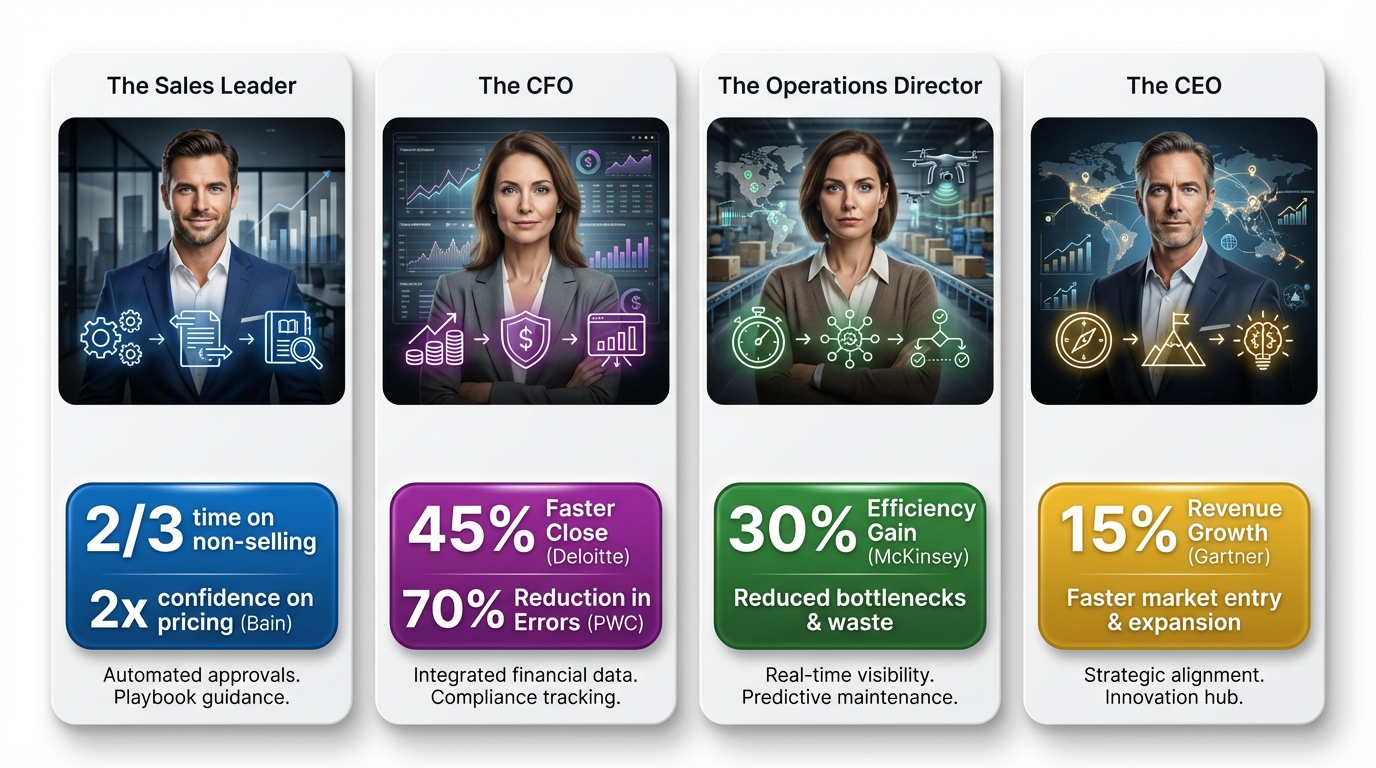
The Sales Leader. McKinsey found non-selling activities consume two-thirds of the average sales team’s time. CPQ gives that time back through automated approvals and embedded playbook guidance. Bain reports reps with dynamic, data-driven guidance are nearly 2x as likely to feel confident on price increases — a leading indicator that correlates with margin attainment when backed by governed data.
The CFO. MGI Research found the average B2B company loses 3–5% of annual revenue to pricing inconsistency, discount sprawl, and quoting errors. On a $250M base, that’s $7.5M–$12.5M per year. Pair with Nucleus Research’s 121% CPQ ROI and the conversation shifts to “why haven’t we done this already.”
The RevOps Leader. Governed pricing and contract processes directly drive NRR and GRR. By 2025, 35% of CROs are establishing dedicated AI operations teams for GTM roles (Bain) — RevOps is evolving from data plumber to commercial intelligence hub.
The Head of Commercial Excellence. Embed rules in the system, not the training manual. The system won’t let reps quote below the margin floor. That’s governance that works.
Change Management: The Part Nobody Wants to Talk About
The hardest part of CPQ rollout isn’t technology — it’s getting reps to stop using their spreadsheets. If the system is harder than the workaround, the workaround wins.
Select the pilot cohort deliberately — a mix of tenure and deal complexity. Results must be credible to the wider org.
Set a 90-day benchmark: percentage of quotes through the system, quote time versus baseline, discount variance. Above 70% system-generated quotes means traction. Below 50% means executive intervention.
Make the system easier than the workaround. If CPQ takes more clicks than the old spreadsheet, reps will find the spreadsheet.
Enlist front-line managers. When managers ask “what does CPQ say about margin?” in every deal review, reps learn the system matters.
Make early wins visible. When pilot quote time drops from hours to minutes and governed deal margins are visibly higher, broadcast the data.
The Leakage Audit. Score Yourself
Score 1–5 on each statement. 1 = entirely manual. 5 = fully automated and measured.
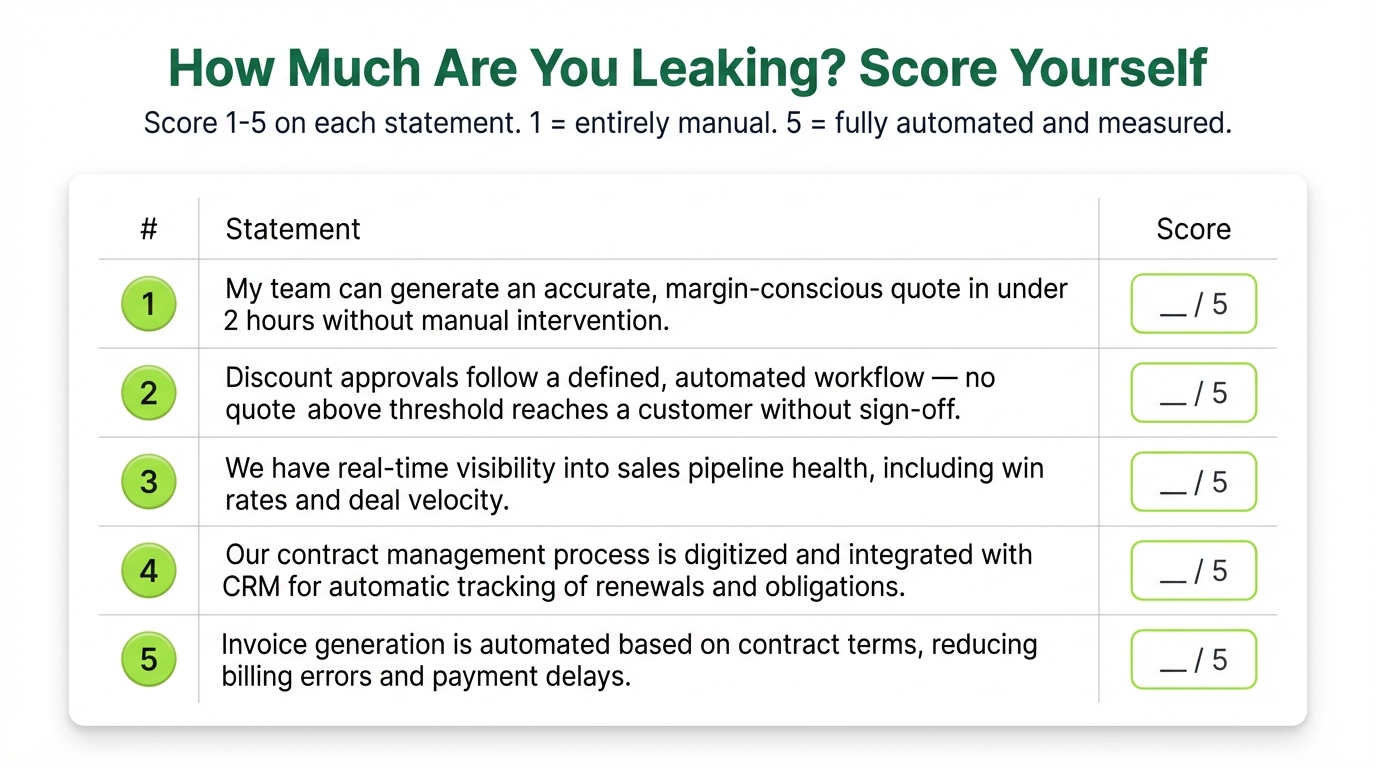
20–25: Stage 3–4. Are you using AI to compound what you’ve built?
13–19: Stage 2. You’re close. The work is integration and enforcement.
5–12: Stage 1. On $250M revenue, that’s $7.5–12.5M in annual leakage. On $500M, $15–25M. Every year you delay compounds in the wrong direction.
The CFO Business Case for Commercial Excellence
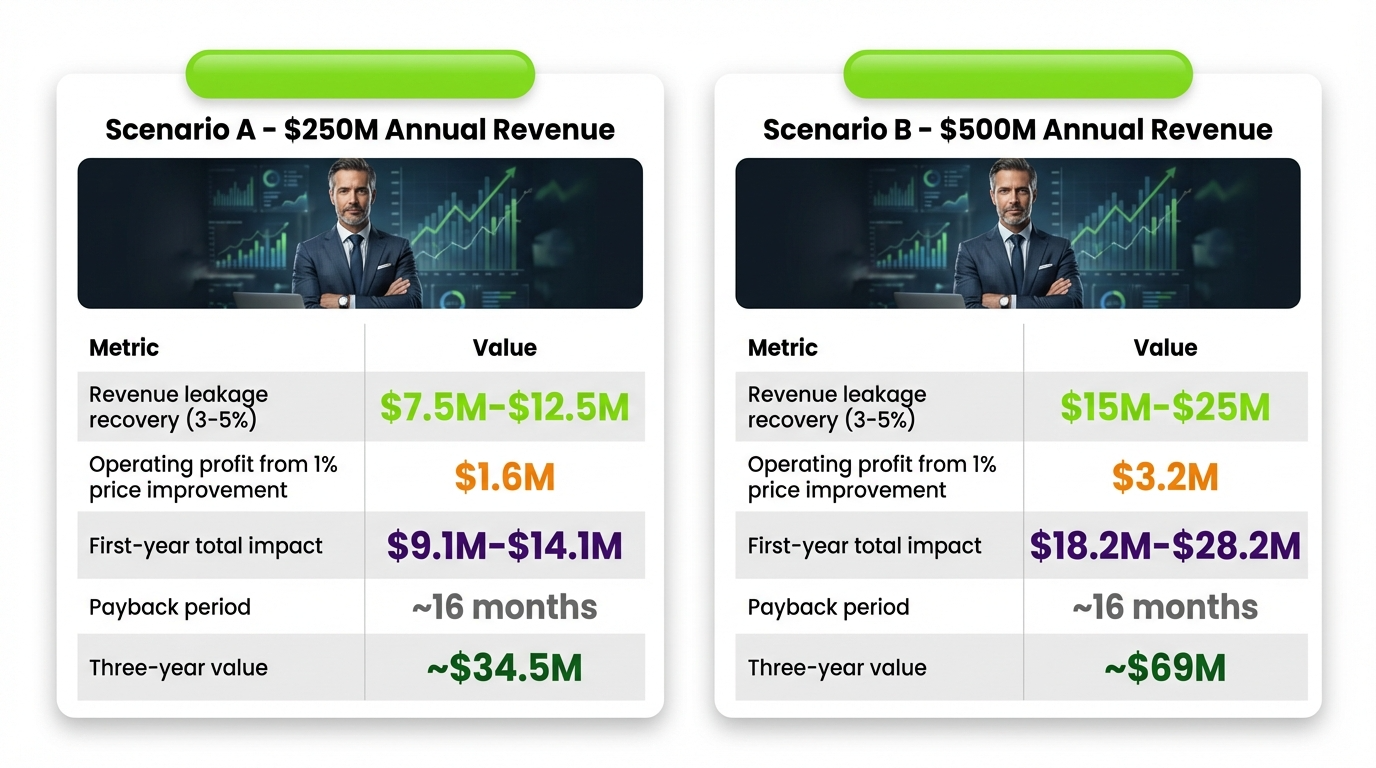 Sources: MGI Research, McKinsey, Nucleus Research. Three-year figures assume sustained recovery; initial rates moderate as major leakage points are addressed.
McKinsey found fewer than 30% of firms achieve simultaneous revenue growth and margin expansion. Those that do deliver 9x total shareholder return — 18% versus 2%. Commercial excellence is how you get there.
Case Study: Dell EMC — From One Day to Fifteen Minutes
Dell EMC’s reps were building proposals manually — chasing approvals through email, losing deal momentum, with zero margin visibility until after close. After implementing servicePath™ CPQ, proposal creation dropped from one full day to 15 minutes. Not a “meaningful reduction.” One day to 15 minutes — the approval ran automatically, the margin floor was enforced, the configuration was accurate. All without a single email to the pricing team.
That’s not a technology win. That’s deal velocity that shows up in win rates, rep retention, and the CFO’s margin report.
📄 Dell EMC cut proposal creation from one full day to 15 minutes. No new headcount. No email chains to the pricing team. See exactly how they did it.
AI in Commercial Operations: Augment, Don’t Automate Blindly
Gartner predicts 40% of enterprise applications will embed AI agents by end-2026, projecting a 25% boost in B2B sales productivity from automating configurations and admin tasks.
However, Gartner also found that by 2030, 75% of B2B buyers will prefer human interaction over AI. Those findings together tell you where AI belongs — back office, not front office.
The servicePath™ principle: AI surfaces the insight. Humans make the decision. The system enforces the outcome.
That three-part logic matters. You don’t want autonomous pricing decisions in complex enterprise deals where context is everything. You want AI surfacing the data your team needs, humans with the authority to act on it, and a governed system enforcing the outcome at scale.
The warning I give every CEO excited about a new AI tool: AI amplifies the quality of your underlying processes and data. It does not fix broken processes. If you have inconsistent pricing data, AI will produce confident-sounding inconsistent recommendations faster than you could produce them manually. Build the foundation first. Then add the intelligence.
Key takeaway: AI does not fix broken commercial processes. It amplifies them. Build the governed foundation first.
From Reactive to Governed: How to Build a Commercial Excellence Engine
Here’s how I’d build a governed commercial engine — staged, sequenced, no shortcuts.
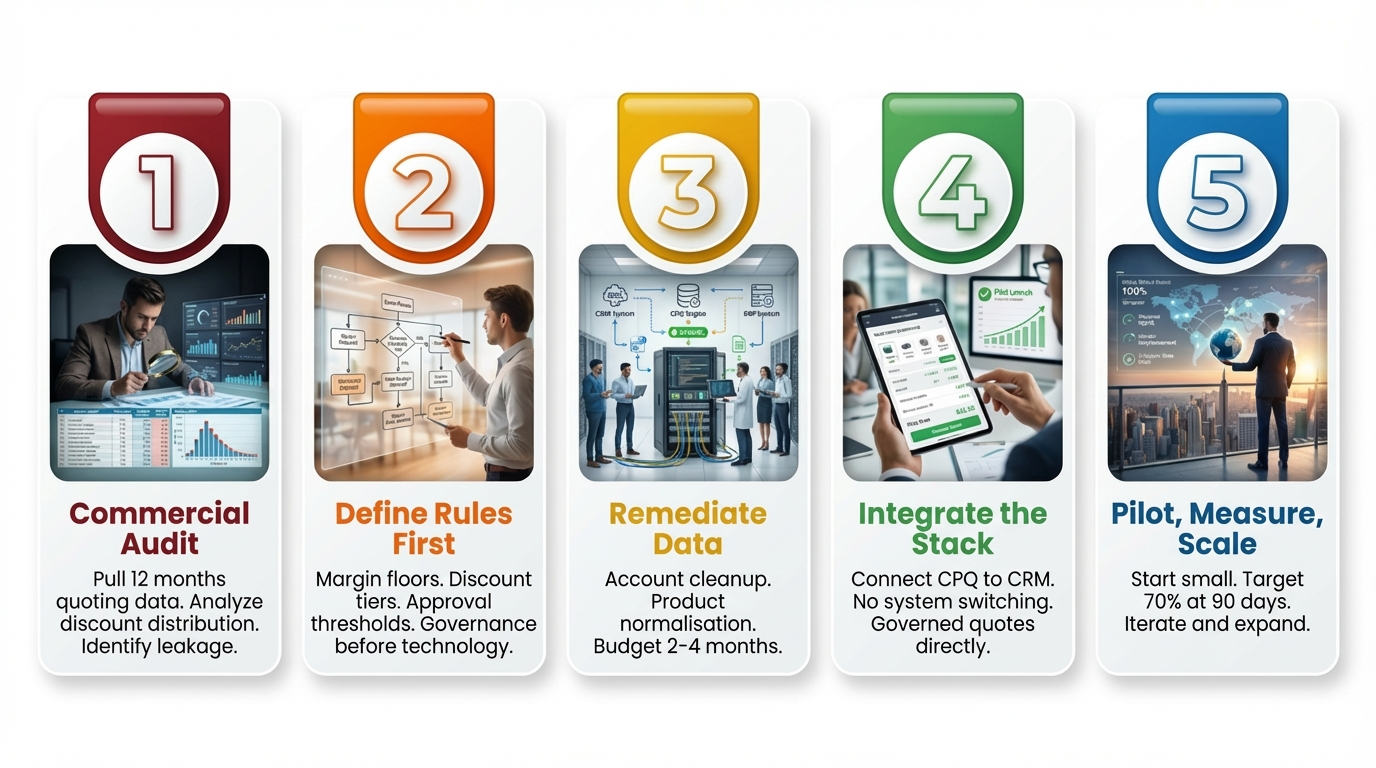
Stage 1: Commercial Audit. Before you buy anything — know your numbers. Pull 12 months of quoting data. What does your actual discount distribution look like by rep, region, product line? What’s your real quote-to-close time? What percentage of quotes convert and at what margin? This tells you exactly where the leakage is and which investments recover it fastest.
Stage 2: Define Rules First. Most companies skip this and go straight to buying a CPQ. That’s backwards. Define your margin floors, discount tiers, and approval thresholds first — precisely. “Discounts over 20% require CFO sign-off.” These rules must exist on paper before they can live in a system. This is a governance exercise, not a technology exercise.
Stage 3: Remediate Data. This step is invisible in most implementation plans and it’s where most failures originate. Account hierarchy cleanup, product catalogue normalization, pricing tier standardization. Budget 2–4 months for this work. It is not glamorous. It is the work that determines whether your CPQ implementation succeeds or becomes expensive shelf ware.
Stage 4: Integrate the Stack. Connect CPQ to your CRM. A rep should be able to generate a governed, margin-conscious quote directly from their CRM opportunity — no system switching, no pricing team email chains. A CPQ sitting outside your CRM is just a more expensive spreadsheet.
Stage 5: Pilot, Measure, Scale. Start with one cohort. Measure quote time, discount variance, and adoption rate. Iterate. Expand. Target 70% system-generated quotes at 90 days. If you’re below 50%, pause and fix the adoption blockers before scaling. Make the early wins visible. The rest will follow.
The Compounding Effect of Continuous Improvement
What makes Stage 4 different: the data loop. Every quote is a data point — configuration, discount, approval path, win/loss, actual versus estimated margin. Over time, this reveals which configurations win in which segments, which reps over-discount deals they’d have won anyway, and which pricing tiers drive expansion versus cannibalization.
McKinsey warns competitive advantages quickly become industry baselines. In 2026, tariff volatility and input-cost inflation compress margins fast. Continuous improvement loops let you dynamically reprice and catch leakage before it hits EBITDA.
McKinsey found companies achieving data-driven commercial growth see 15–25% EBITDA uplift. Those with both revenue growth and margin expansion deliver 9x total shareholder return.
The Commercial Excellence Mandate for 2026
The complexity of the commercial environment in 2026 is not going to decrease. Gartner expects more than 80% of enterprise sales cycles will require shared digital workspaces to manage stakeholder volume, complex pricing, and mutual action plans.
Unified platforms orchestrating multiple CRMs under one revenue engine can cut operational costs by 50% while doubling GTM efficiency (servicePath™ CPQ Trends 2026). Bain found that winners invest consistently in long-term commercial productivity, while laggards treat it as a short-term reaction to margin pressure. The gap is widening. AI is about to widen it further.
I’ve never met a CEO who looked back and said “I wish we had waited longer to fix our pricing governance.” Commercial excellence isn’t a project you complete. It’s a standard you keep raising. The companies that build commercial excellence as continuous operational muscle — not a one-time initiative — are the ones that compound growth, protect margin, and make AI work for them instead of against them. Start now.
Vendor Evaluation: Five Questions Before You Sign Anything
Regardless of which vendor you evaluate, these five questions separate serious platforms from demo-ware.
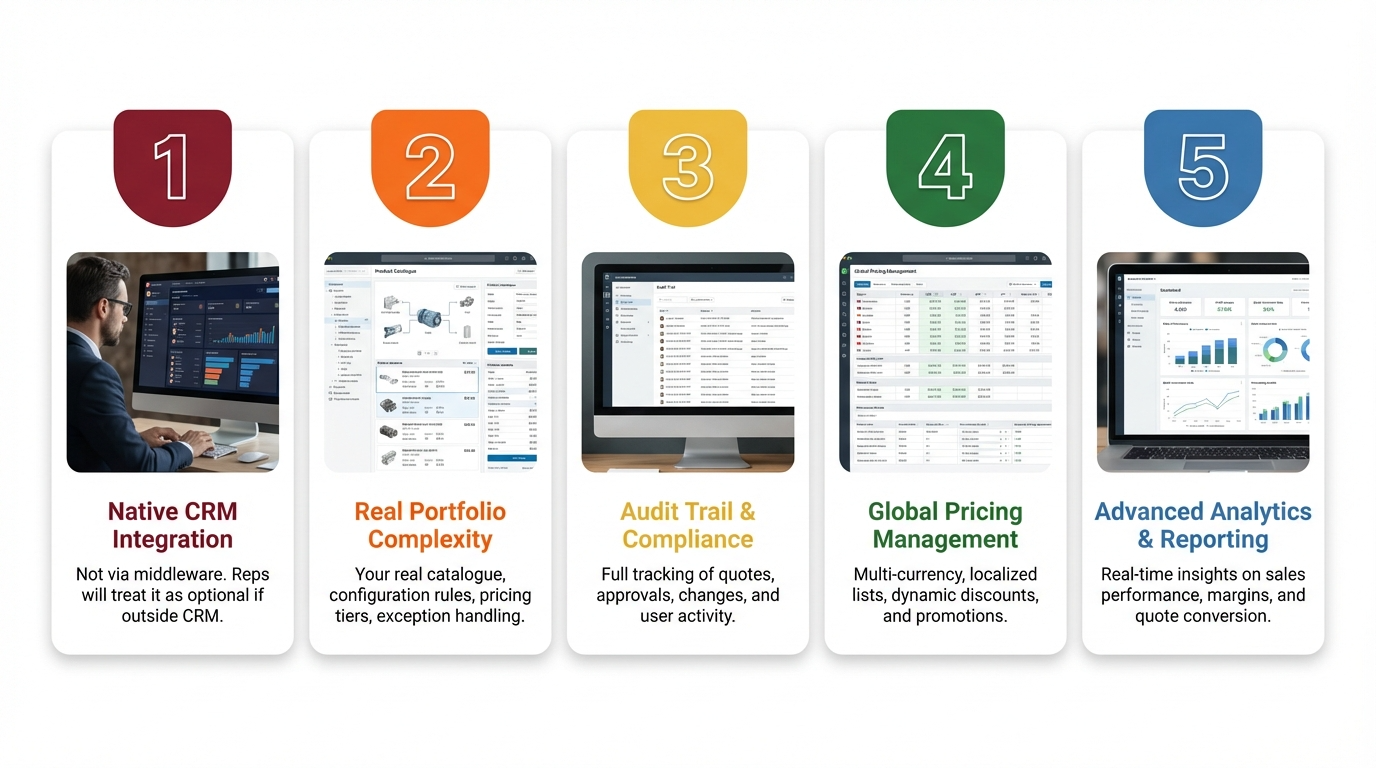
- Does it integrate natively with the CRM you already use? Not via middleware. Native. If CPQ sits outside your CRM, reps will treat it as optional.
- Can it handle the actual complexity of your portfolio? Not a three-product demo. Your real catalogue, real configuration rules, real pricing tiers, real exception handling.
- Does it provide a full audit trail for pricing and approval decisions? For ASC 606/IFRS 15 compliance. For the conversation your CFO will have with auditors.
- What does a failed implementation look like? Ask for both success and failure stories. Any vendor who can’t describe failure isn’t being straight with you.
- What does rep adoption look like six months post go-live? Ask for adoption metrics, not satisfaction surveys. That conversation will be more revealing than any demo.
About servicePath™
servicePath™ builds the commercial engine that mid-to-large tech-enabled enterprises actually run on — CPQ, pricing governance, and RevOps infrastructure that replaces the spreadsheet chaos quietly draining your margin right now.
We integrate natively with Salesforce, HubSpot, and Microsoft Dynamics 365, and NetSuite — no middleware, no workarounds, no reps treating the system as optional. Our spreadsheet-native UI means your commercial team configures pricing without filing an IT ticket. Our modular architecture means you start where the fastest payback is and build from there.
This isn’t a transformation programme you hire a consultancy to deliver. This is infrastructure you own — that gets smarter with every deal your team closes.
Companies like Dell EMC cut proposal creation from one full day to 15 minutes using servicePath™ CPQ. Not a percentage reduction. One day to 15 minutes — with automated approvals, enforced margin floors, and zero email chains to the pricing team.
We exist for one reason: to help you build a commercial engine that works the way your business works — and keeps getting better.
👉 Book your Commercial Excellence Assessment
Frequently Asked Questions About Commercial Excellence
What is commercial excellence?
Commercial excellence is the alignment of sales, marketing, pricing, and customer strategy to drive profitable revenue growth. It requires consistent processes, data-driven decisions, clear accountability, and continuous improvement.
What are the four stages of the commercial excellence continuum?
The four stages are: Reactive, Structured but Inconsistent, Governed, and Optimised and Compounding. Most companies are stuck at Stage 1 or 2.
What is Revenue Lifecycle Management (RLM)?
Revenue Lifecycle Management unifies CPQ, CLM, billing, and renewals under a single data model. It is critical for businesses with complex, recurring, or usage-based pricing models.
What ROI can I expect from CPQ implementation?
According to Nucleus Research, CPQ delivers an average 121% ROI with a 16-month payback period, a 36% revenue increase, 42% admin cost reduction, and 56% quoting efficiency improvement.
How long does a commercial excellence implementation take?
Including data remediation, the transition from Stage 2 to Stage 3 typically takes 9 to 18 months. However, piloting with a single cohort can show measurable results within 90 days.
Sources
MGI Research – Revenue Leakage
McKinsey – Commercial Excellence Path to Growth
McKinsey – Winning with Commercial Excellence
McKinsey – The Power of Pricing
McKinsey – Data-Driven Commercial Growth
Bain – Commercial Excellence Agenda
Gartner – B2B Buyers Prefer Human by 2030
Gartner – SalesOps Time Allocation
Deloitte – Q4 2025 CFO Signals
Forrester/Gartner – 2026 CRM Trends
servicePath™ – CPQ Trends 2026